Marketing is fun, right? Flashy graphics. Fun campaigns! Exciting budgets!
I’ve run more than a thousand different marketing campaigns over the years I’ve been in this business, and the #1 thing that everyone does wrong when they run campaigns is that they don’t build out their reporting to answer questions.
I get a little shouty about this sometimes.

So let’s talk about it.
Most marketers generate reports for 3 reasons
- Their boss demands it
- They want to answer a question right now
- They need to justify spend budgets
These all sound like good reasons to generate a report, but they don’t serve the single reason you should be reporting on marketing performance: to document lessons and apply them to future campaigns.
A marketer worth her salt will probably hold in her head what she has learned from 3 months or 3 years of launching campaigns for a given company, but that’s really not duplicatable or easy to pass on. And even the best of us forget things sometimes.
How can you build a reporting system that will answer the 3 common needs above + equip you for long-term learning and sharing?
You’ll need to institute a 3-tier reporting system. Here’s how.
Building a 3-tier reporting system
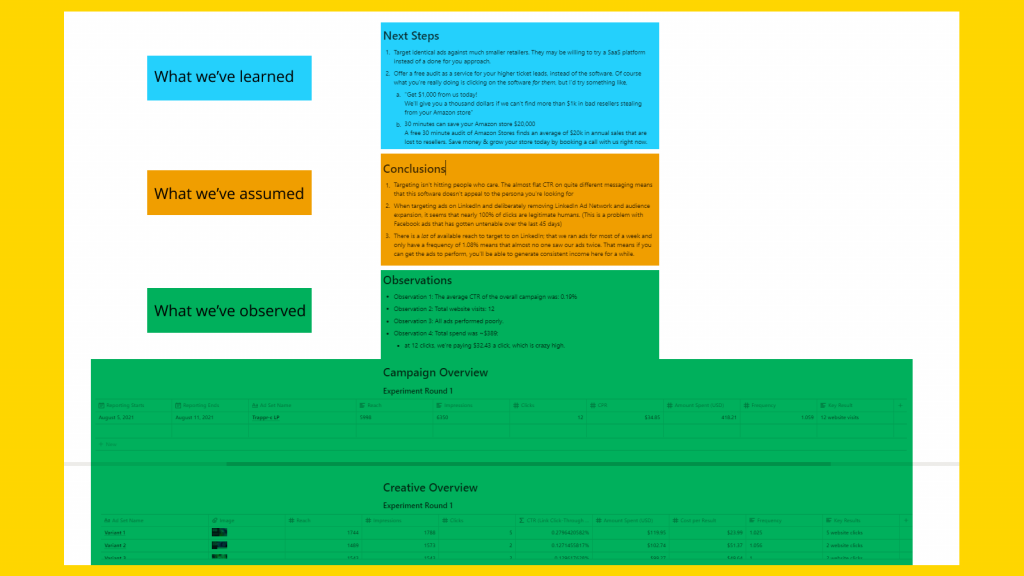
Good reporting provides you with 3 levels of information
- What we’ve learned
- What we’ve assumed
- What we’ve observed
The most detailed information in your reporting exists in level 3. It’s mostly a factual report of numbers. You keep these around for the subject matter experts to access and for going back to check on your assumptions weeks or years later.
The most intellectual effort goes into level 1. It’s the lessons you have abstracted from the information in your observations. It’s the kind of thing you present to a client or your company’s CEO. They don’t pay to read the number of clicks a link got. They pay you to tell them what that number means.
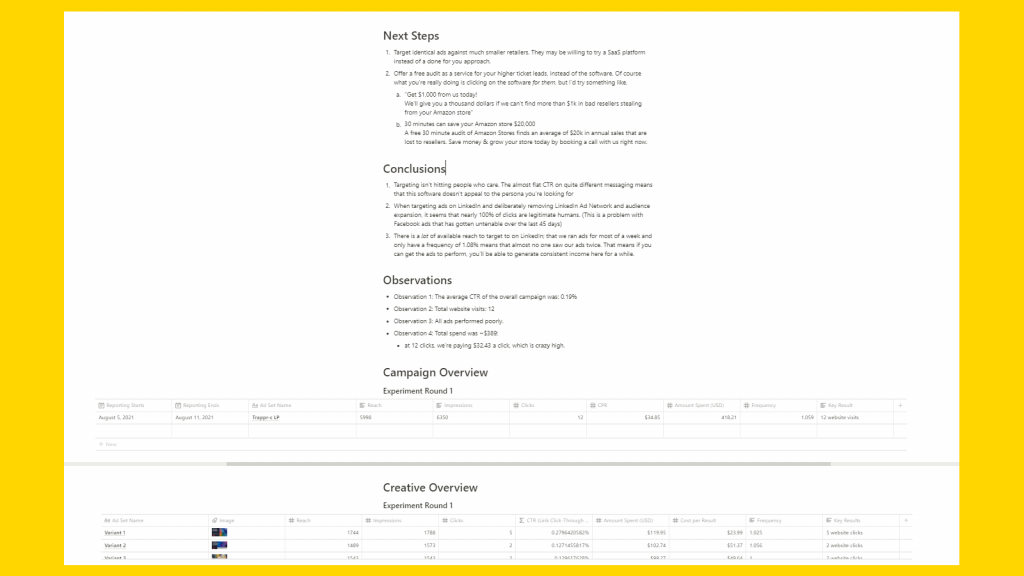
When we generate reports for our clients, CrowdTamers follows this template.

Next Steps tells you the actions we’re taking based on what we’ve learned.
Conclusion is what we’re assuming based on the data.
Observations are obvious. 😂

Each of our client reports is a snapshot—it’s the lessons, assumptions, and observations for a given experiment. It can be invaluable to collate all of the data from these experiments into a master view, where we can see all of our conclusions, assumptions, and observations across each experiment for a client—and even across all clients—in a single place.
This is easy to build in spreadsheets that you just copy-paste everything into after each experiment, but we’ve got a more elegant system we use at CrowdTamers. We’ll be sharing it with you next week as part of our Growth Marketing Command Center. Stay tuned! 🙂
Any questions about our reporting? Anything you would do differently? Let us know @trevorlongino or @crowdtamers on Twitter!


