Google has announced that from July next year (2023) it will stop collecting data from the older version of Google Analytics. It is time to migrate to Google Analytics 4!
Google Analytics 4 – What’s changed?
In short…
a lot.
GA4 uses a significantly different data structure and data collection logic.
Now, everything is built around users and events – not sessions, as we’ve been used to.
An events-based model processes each user interaction as a standalone event.
Should I switch to Google Analytics 4?
This is the big question – do you need to switch to Google Analytics 4 right now?
Short answer: yes.
Set up a GA4 property to run in parallel with Universal Analytics.
Even if you don’t plan on using it right away, collecting data and strengthening your machine learning (ML) models will make future analysis more meaningful.
Better data collection = better-informed marketing strategies.
How to set up Google Analytics 4?
Once you move to Google Analytics 4, prepare for a shock! The interface is not so intuitive.
Setting up Google Analytics answers questions like:
- How many conversions did my Facebook campaign trigger?
- How is my content performing?
- Do visitors actually watch the video I produced?
- Which product category is the most popular?
- Are there any pages that perform particularly badly?
- Do people drop out during the checkout process? and more!
How does GA4 help with reporting?
A data collection strategy is only as strong as the information you can extract from it.
So how will switching to GA4 help with reporting?
With the push for user privacy, it’s becoming increasingly difficult to track users as they travel across multiple platforms, using multiple devices.
GA4 is a forward-thinking solution using enhanced machine learning techniques to help fill in the missing data gap. Creating a single user journey for all data linked to the same identity.
Lastly, GA4 simplified the reporting interface making it really easy for marketers to spot key trends and irregularities in data.
Instead of a long list of predefined reports that try to cover every use case, GA4 uses overview reports in summary cards. If you want to dig in deeper, simply click on the scorecard.
Best ways to use Google Analytics 4 reports
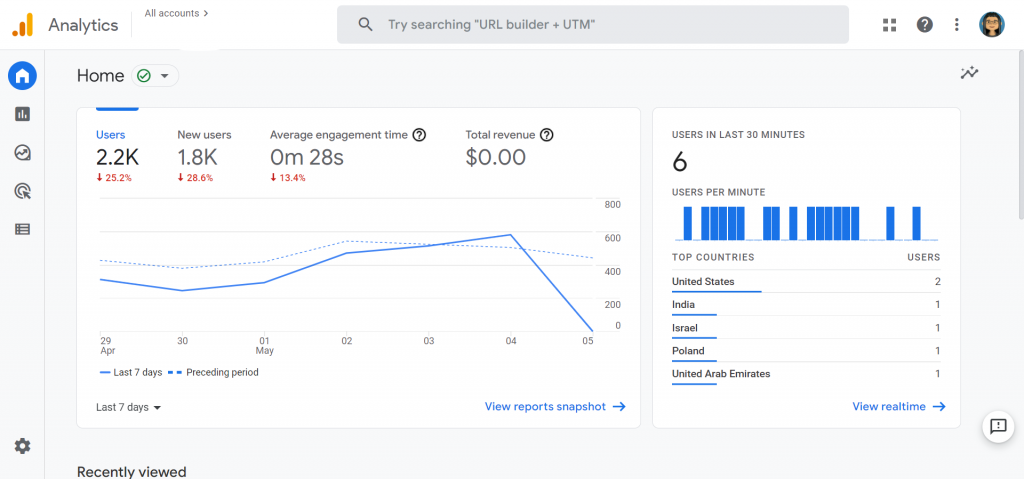
When you first log in, you’ll see that the home page summarizes overall traffic, conversions, and revenue for that property. This is best used as a quick check to make sure everything is behaving as expected.
Your home page report will quickly answer:
- Which pages and screens get the most views?
- What are your top-performing campaigns?
- Where do new users come from?
Realtime Report
The realtime report is the next default report in the left navigation, and it shows events that happened within the past 30 minutes.
Use the Realtime Report to quickly:
- View New Product Drop, as it happens in real time.
- Confirm tracking code is working.
- View Effects from a YouTube Video.
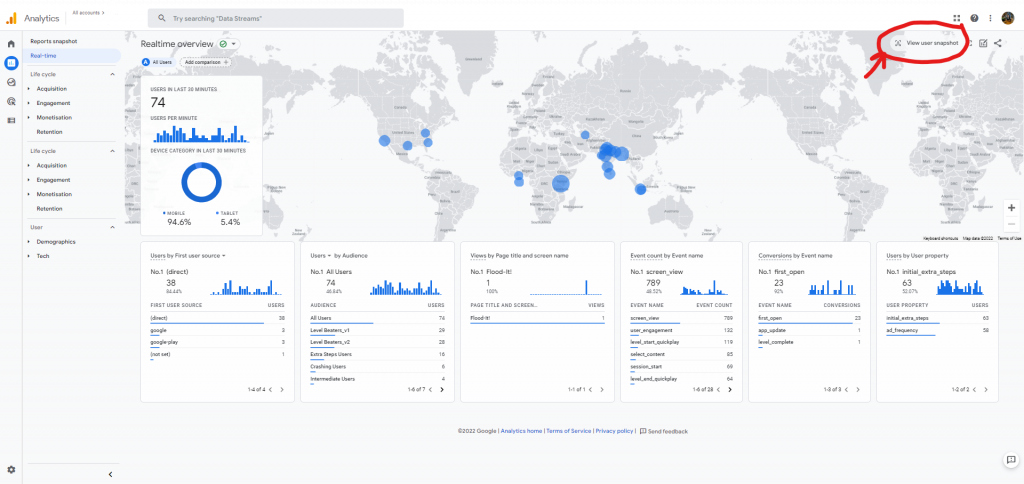
Cool Feature: “View User Snapshot”
Click View user snapshot in the top right corner of the Realtime report to see a literal snapshot for a single user.
This includes information about the user’s device, location, and real-time engagement with the site/app through events triggered.
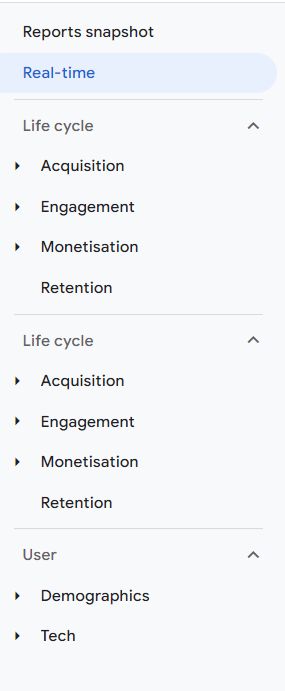
Life Cycle Reporting
Life Cycle reporting mirrors the funnel of engaging, retaining, monetizing, and` acquiring users.
It’s ideal for analyzing how users enter the conversion funnel and how they behave once they’re in the funnel.
Life Cycle Reports will quickly answer:
- How do users enter the conversion funnel?
- How do users behave once they’re in the funnel?
GA4 also includes user reports on demographics and technology, as well as events and conversions.
Explorer Report
This may be the most powerful change in GA4 (or at least what I think will be the most beneficial for marketers): the new Analysis Hub.
While default reports help you monitor key business metrics, the GA4 Analysis Hub gives you access to several advanced techniques and a template gallery that isn’t available anywhere else.
Creating a new Analysis
- Login to your Google Analytics Account.
- Click Explore.
- Select the technique you want to use to analyze your data.
How Exploration works
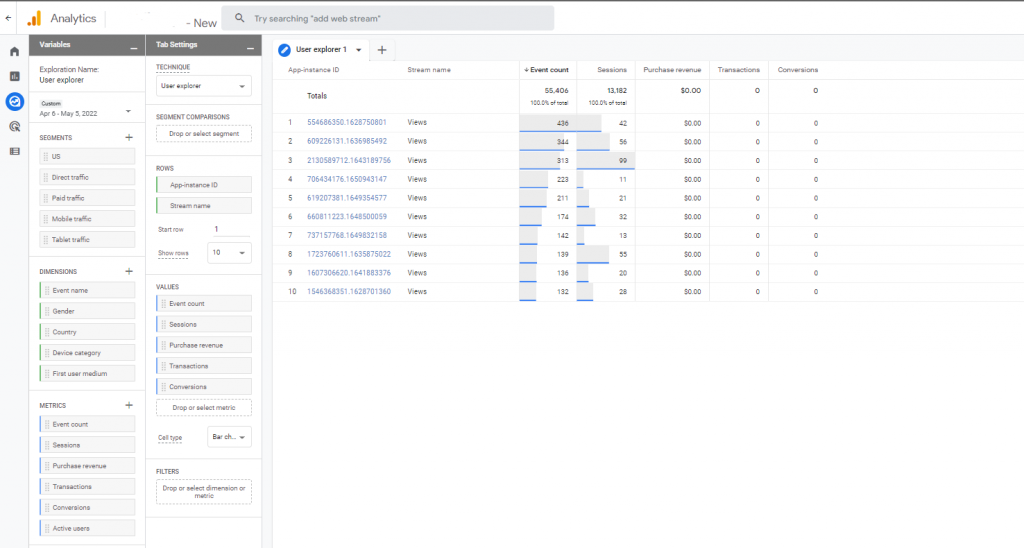
- Variables Column: The variables column is where you will select the data you want to use in your analysis. Date range, segments, dimensions, and metrics.
- Tab Settings Column: The tab settings column is where you will specify the analysis technique, add dimensions, metrics, and apply segments.
- Segments: Segments are different groups of users. Drag and drop different groups of users to your report to compare and contrast how they are behaving. If you don’t see the segment you want to use, add your own by clicking on the plus icon.
- Dimensions: Dimensions are the things you want to analyze. For example, event count, active users, transactions, etc. Drag and drop dimensions as rows or columns in the Tab Settings area.
- Metrics: Metrics provide the numbers in your analysis. Add metrics to the Values area in Tab Settings.
- Visualization: Choose what the report will look like. Exploration options include table, pie chart, line graph, and more.
- Values: Drag the metrics that you want to display as columns in the report. Cell type can be displayed as a bar chart, plain text, or heat map.
- Tabs: Tabs display your visualizations. An analysis can contain up to 10 tabs. To add a new tab, click the plus icon.
- Display: Interact with the data by right-clicking a data point in the visualization.
Better analytics insights = better marketing decisions.
GA4 is the analytics upgrade we all needed. It provides marketers with more flexibility and a means to predict user behavior while upholding user privacy.
Once you get through the learning curve, you’ll find GA4’s flexibility and enhanced insights are more than worth it.